
From raw data to decisions your team trusts
We build the analytics layer behind good decisions: clean data models, automated pipelines, and dashboards people stop arguing with.
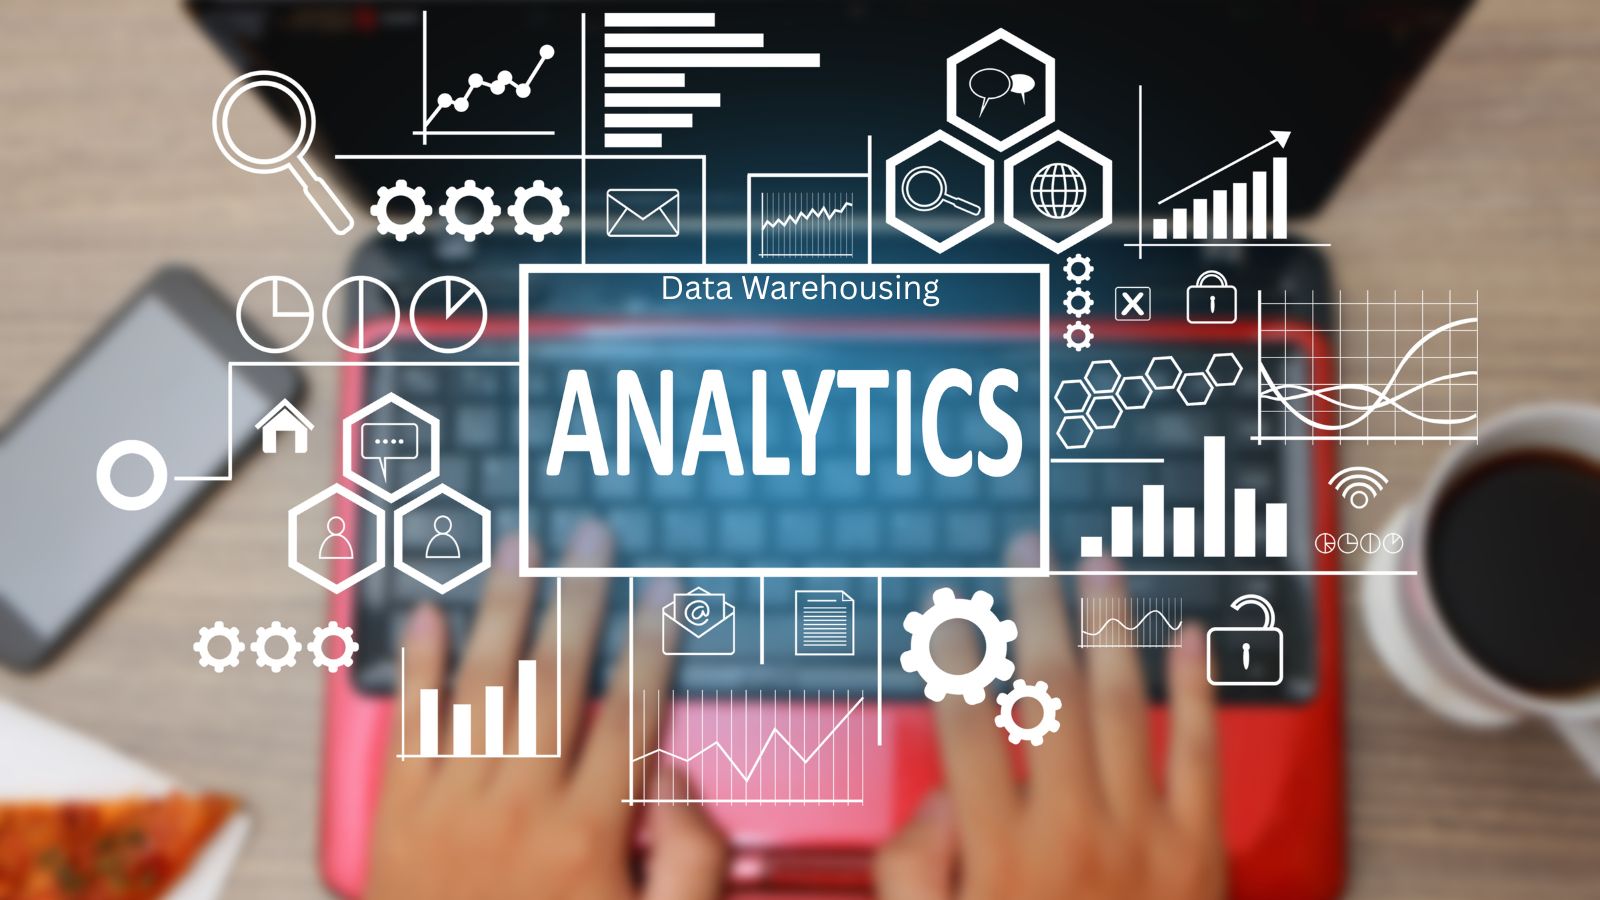
Analytics as a product
The problem is rarely "not enough data" - it is unreadable data. We model, document, and surface the metrics that matter in a way everyone agrees on.
What Data Analytics includes
- Data modeling and dbt pipelines
- ETL/ELT architecture and orchestration
- Dashboard builds for Looker, Power BI, and Tableau
- KPI definitions and a governed metric layer
- Self-service analytics enablement
- Data quality monitoring
- Source system integration: CRM, product, finance, marketing
- Documentation and data dictionaries
We build the trusted analytics layer that turns scattered, messy data into a foundation for confident decisions. Using dbt, SQL, and modern ETL/ELT pipelines with Looker, Power BI, or Tableau on the front end, we give you one place where a single metric has a single definition everywhere. This is for teams drowning in inconsistent spreadsheets who need their numbers to mean one thing to everyone.
The outcome is measurable: analysts answer their own questions without waiting weeks for reports, executives see one version of the truth, and leadership makes decisions on data they no longer argue about.
Capabilities we deliver
The analytics engineering skills behind dashboards people trust.
Data modeling
Transform raw tables into clean, documented, reusable analytics models.
- dbt models and tests
- Grain definitions and joins
- Versioned schema changes

Pipelines
Reliable, monitored ETL/ELT that keeps dashboards fresh on schedule.
- Orchestration and scheduling
- Incremental load patterns
- Failure alerts and retries

Self-service BI
Dashboards and metrics your team can explore without a ticket.
- Governed metric layer
- Curated data catalog
- Analyst onboarding and training

Dashboards & reporting
Reports decision-makers open and actually use.
- Looker, Power BI, or Tableau
- Interactive filters and drill-downs
- Scheduled email delivery

Data quality monitoring
Catch bad data before it reaches a decision.
- Freshness and volume checks
- Anomaly detection
- Lineage-based impact alerts

Analytics engineering
Code-first modeling with testing and review built in.
- Git-based model versioning
- Test-driven transformations
- Auto-generated documentation
From messy spreadsheets to a trusted analytics layer
Audit the data landscape
We map your sources, find the conflicting definitions, and identify the questions your business most needs answered.
Agree the metric layer
We lock down KPI definitions with your stakeholders so every dashboard and report speaks the same language.
Build pipelines and models
We stand up ETL/ELT pipelines and dbt models that turn raw sources into clean, tested, documented tables.
Ship dashboards
We build and iterate on reports with the people who will use them, so they answer real questions, not theoretical ones.
Enable and monitor
We train your analysts on self-service access, then monitor data quality so trust compounds over time.
What a trusted analytics layer changes
The results teams see once metrics are consistent and dashboards stay fresh.
Decisions on the same numbers
Finance, marketing, product, and sales finally agree on what the data says.
Faster answers to business questions
Requests that took weeks drop to same-day self-service lookups.
Analysts serve themselves
Your team explores governed metrics without waiting for a report build.
Fewer conflicting reports
One metric, one definition, everywhere - no more dashboard arguments.
Trust in data quality
Monitoring and tests catch problems before they reach a decision.
Leadership sees business truth
Executives track the KPIs that matter, backed by data they believe.
Common questions about data analytics services
Which BI tools do you work with?
We build and support Looker, Power BI, and Tableau. We recommend the right fit for your team and stack, and we can connect them to your existing warehouse.
How long before we see dashboards?
We typically have first usable dashboards within four to six weeks of starting, focusing on the metrics that matter most first.
Can you work with our existing data stack?
Yes. We integrate with SQL databases, cloud warehouses, CRMs, and SaaS tools you already use, and we bring dbt and orchestration where they add value.
Who owns the analytics after handover?
Your team does. We train analysts on the models and dashboards, document everything, and stay on for support and iteration as your questions evolve.
Explore our services
Dive deeper into the full service catalog.


Ready to transform
your business?
